
In urban planning over the decades, it has become clear how a city acquires quality affordable housing: Build high quality buildings, and wait a hundred years. In this visualisation of 2016 data on tenant households, it is evident that only one of Canada's two most vibrant cities has followed that plan.
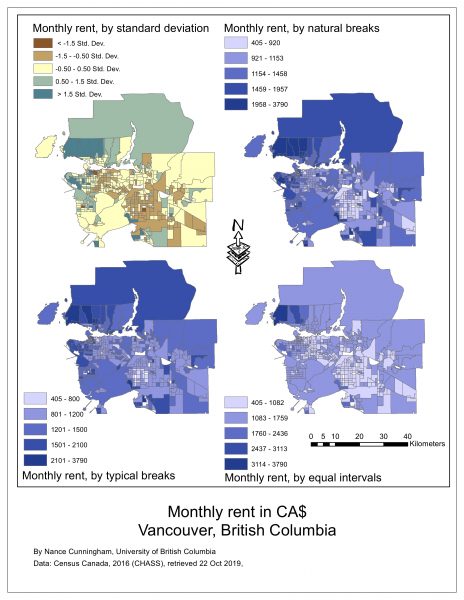
To the right, 2016 rental prices in Vancouver are shown on a map. Monthly rent ranged from $405 to $3790 according to census figures. Rents are variously divided by standard deviation, grouped as detected by algorithm, equal intervals, or typical breaks in rent. However, you slice the rental price cake, it's pretty rich.
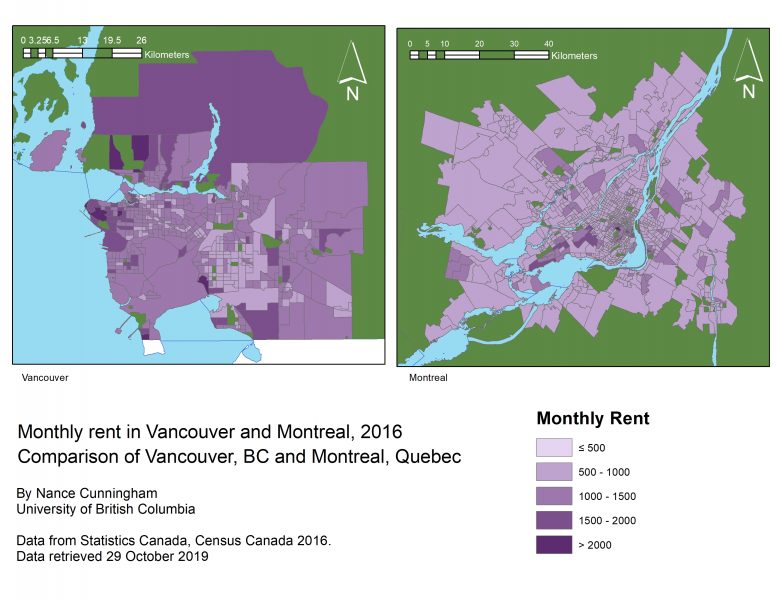
Compare Vancouver — which has restlessly been tearing down its housing stock and rebuilding in variable quality for decades — to Montreal, where there are more older buildings. The maps below compare the rent in the two cities. The darker areas show more expensive housing in dollar terms. But what about in terms of income? Perhaps households in Vancouver earn more than Montreal households. Read on below the maps for affordability compared.
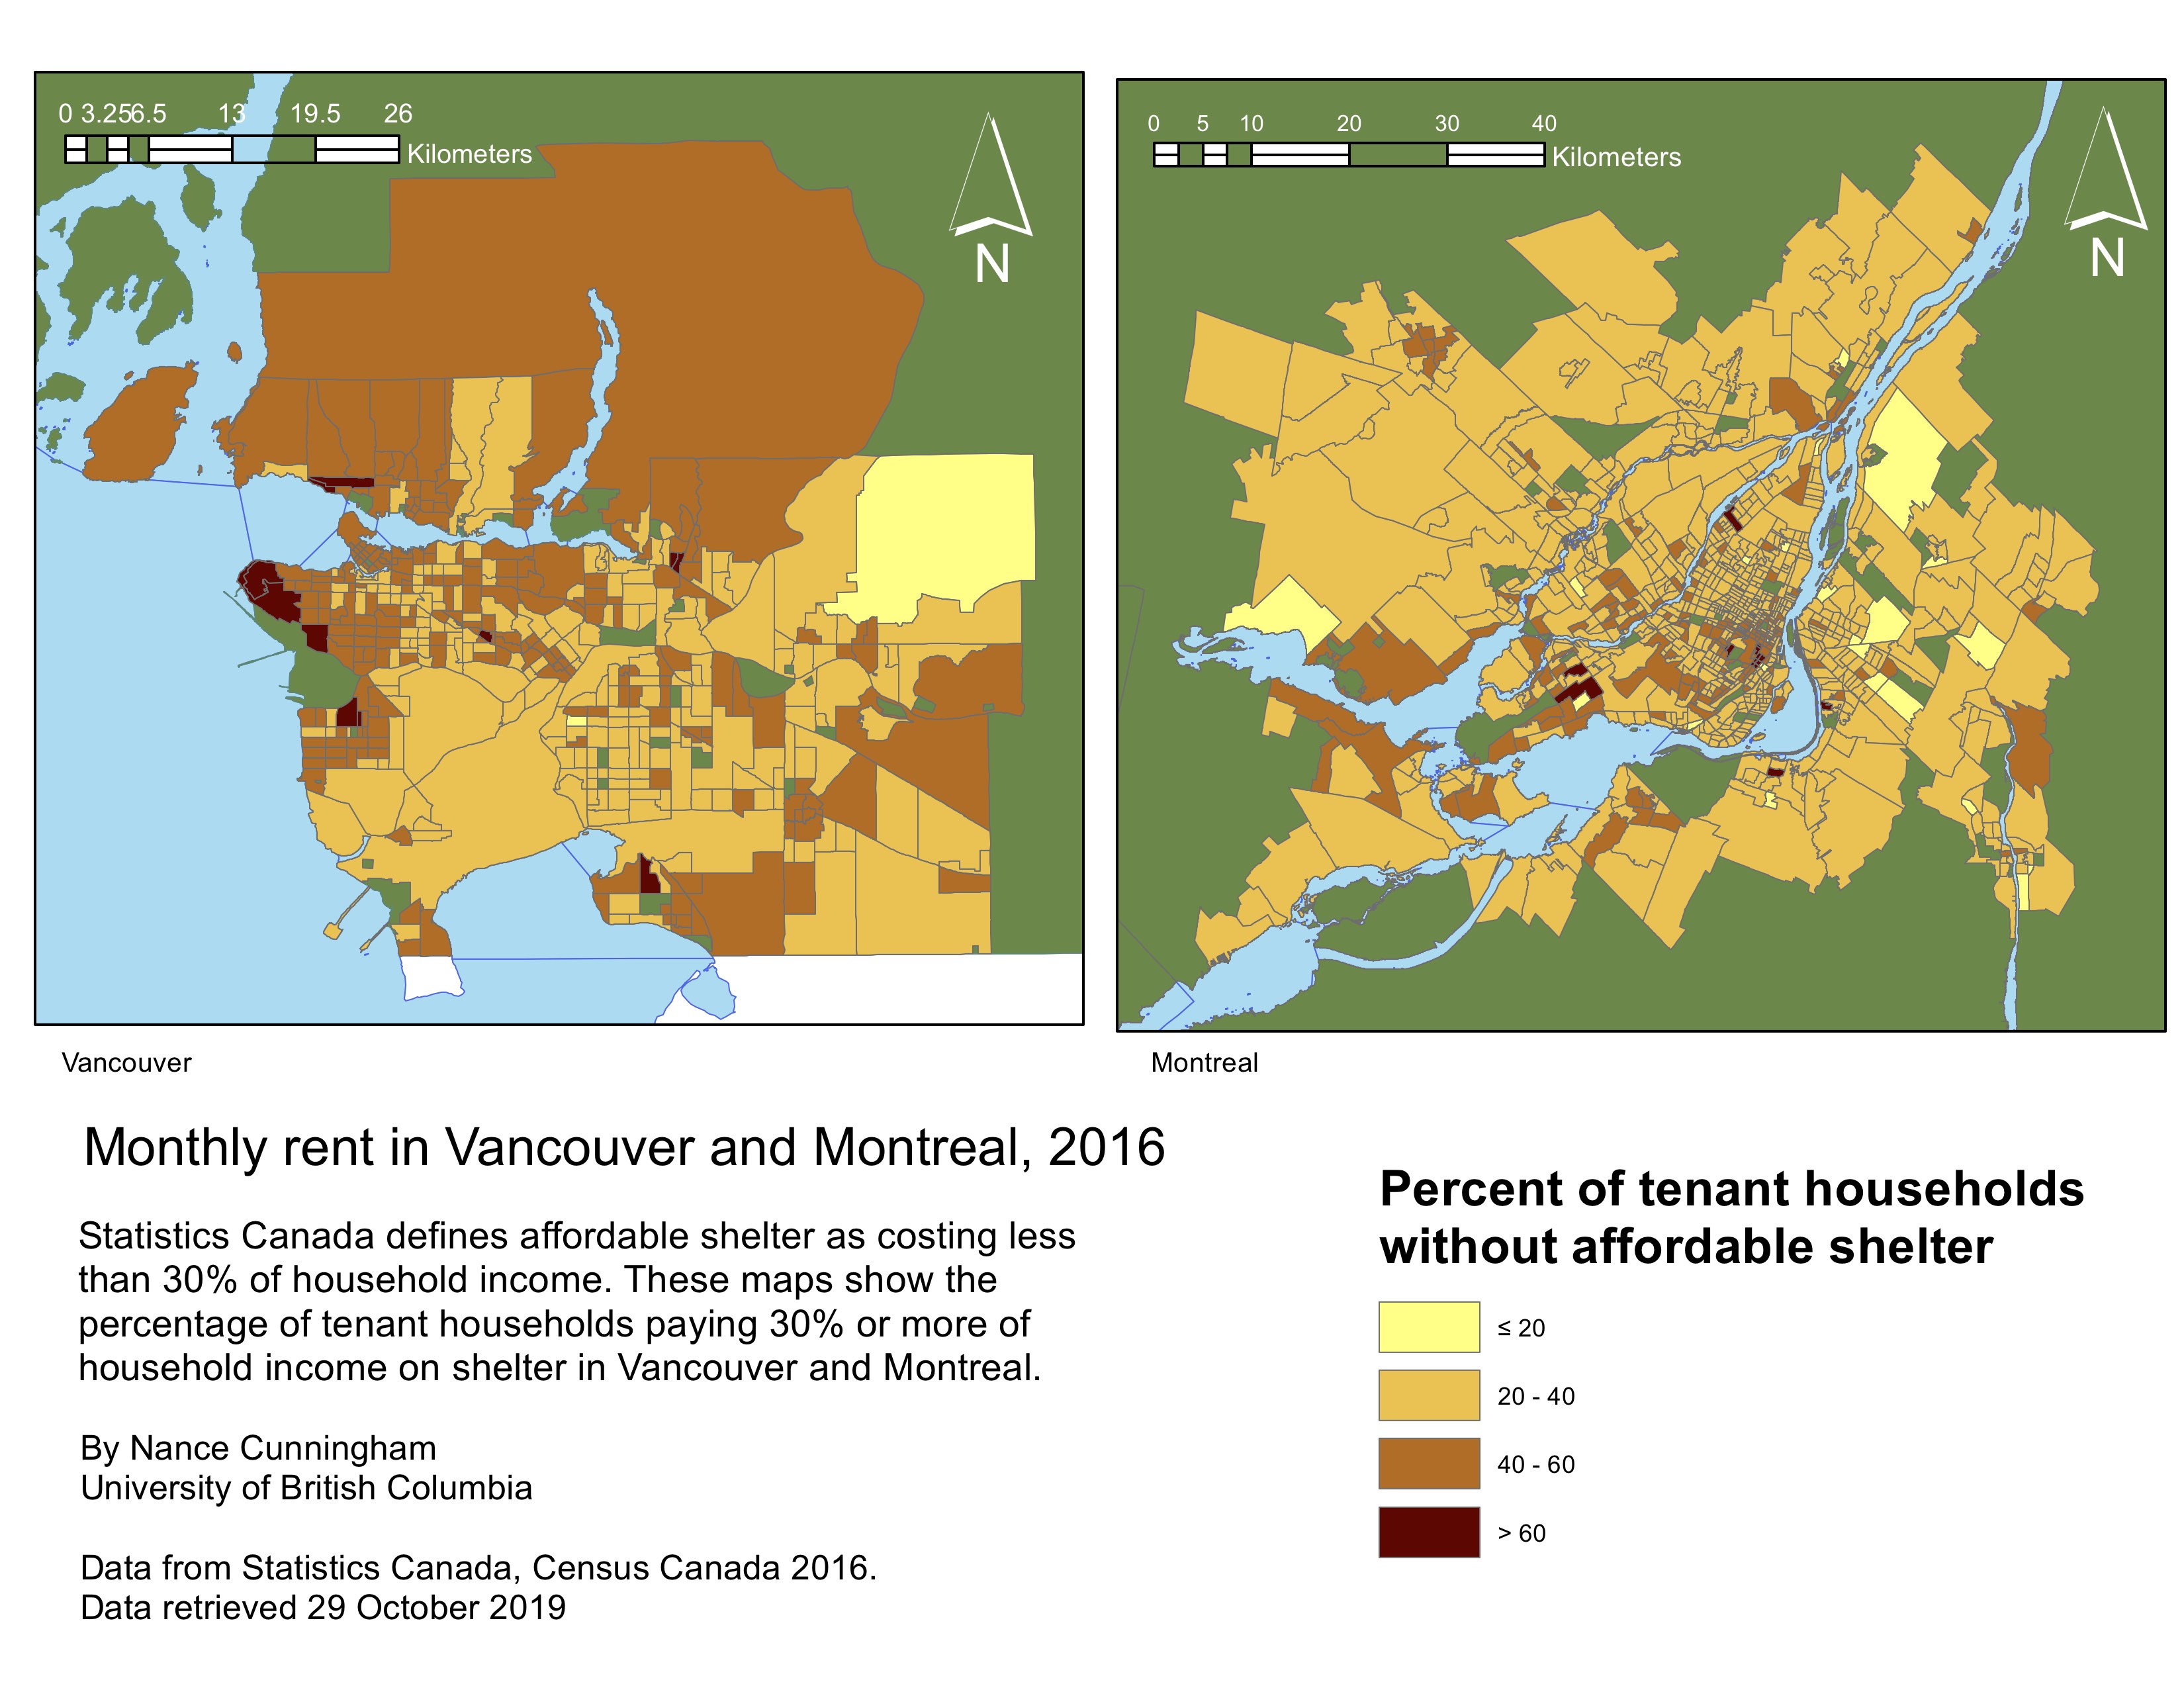
 Affordability for renters is defined in Census Canada terms as spending 30% of less of household income on shelter. The maps below compare affordability — or lack thereof — of rental housing for the people living in it. The lighter portions show areas where only 20% or less of renters are paying more than 30% of household income on rent. The darkest areas show places where over 60% of households are spending more than 30% of income on rent.
To make these maps, I learned how to:
• import census data
• map tabular data to the appropriate census areas
• reclassify data in a variety of ways for comparison and analysis.
I created a classification which coded the same values to different maps, to allow easy comparison. I ensured that the colours chosen were visible to a large audience, and that the contrast between two comparisons was signaled through a colour change.